Introducing the platform
The truth is already in your systems.
One engine. Two surfaces. Private operational data through Process Evidence Studio. Public performance records through Parallax.
The Lanthra suite
PULSE
AI readiness
Measures whether an organisation can capture the value it identifies at strategy stage.
Take the free PULSE →PES
Process Evidence Studio
Surfaces the gap between the designed process and what your event log shows is actually happening.
Parallax
Public-sector benchmarking
Turns open performance data into the expected-versus-actual comparison.
EXPLORE PARALLAX →The engine
One analytical method. Four properties that make it defensible.
01
Expected versus actual
The engine models what context predicts (sector, scale, complexity, volume) then surfaces the residual. The residual is the signal. What context cannot explain is where the analytical question lives.
02
Structural versus controllable
The residual splits into two parts. One is structural: it reflects circumstances the organisation cannot change (geography, statutory obligations, inherited infrastructure). The other is controllable: it reflects decisions, processes, and effort. Only the controllable part is actionable. The engine separates them before surfacing any recommendation.
03
Honest about limits
Power-checked, significance-corrected, and designed to report nulls. When there is insufficient evidence to separate signal from noise, the engine says so. Correlations are quarantined from causation claims. The output is a position the analyst can defend, not a confident-sounding inference the data does not support.
04
Compounds on outcomes
Every recommendation is tracked against what actually happened. The record feeds back into the model. Over time, the engine sharpens on the outcome distribution of this specific dataset, not a generic prior.
Worked example
Local government benchmarking
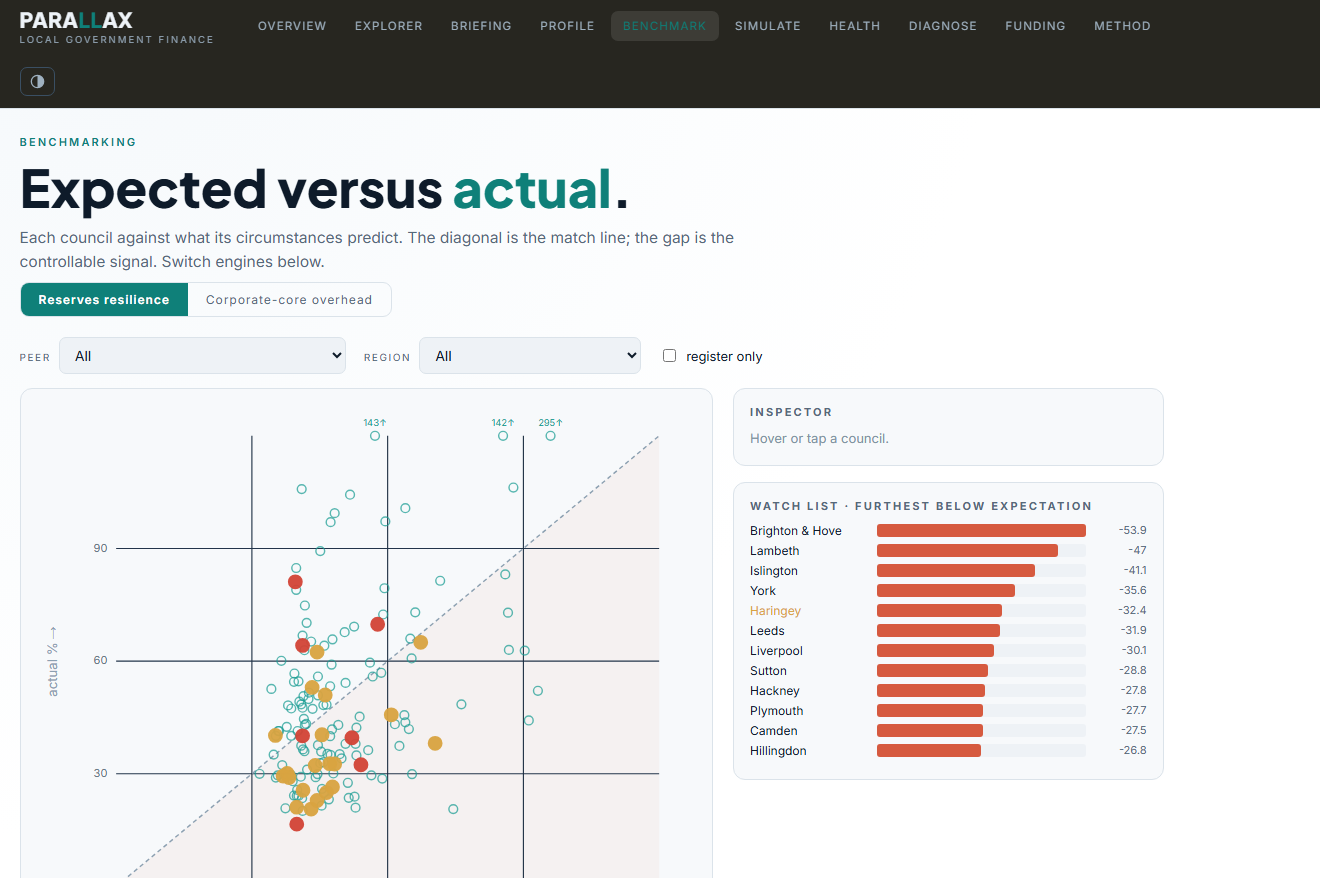
The engine applied to 317 English councils. Each point is a council. The vertical axis is performance. The horizontal axis is context. The colour separates structural from controllable variation. Points above the band are outperforming their context. Points below are not.
Process Evidence Studio
The engine, pointed at your operational data
PES is the engine applied to process data. It takes an organisation's event log (every timestamped record of work moving through a system) and separates the designed process from what is actually happening.
The designed process is not the actual process
Every organisation has a process diagram. Most have never measured the gap between that diagram and the event log. Rework loops, long-tail variants, and bottlenecks that appear nowhere in the design are invisible until the data is interrogated. That gap is where cost and risk live.
Upload, detect, run
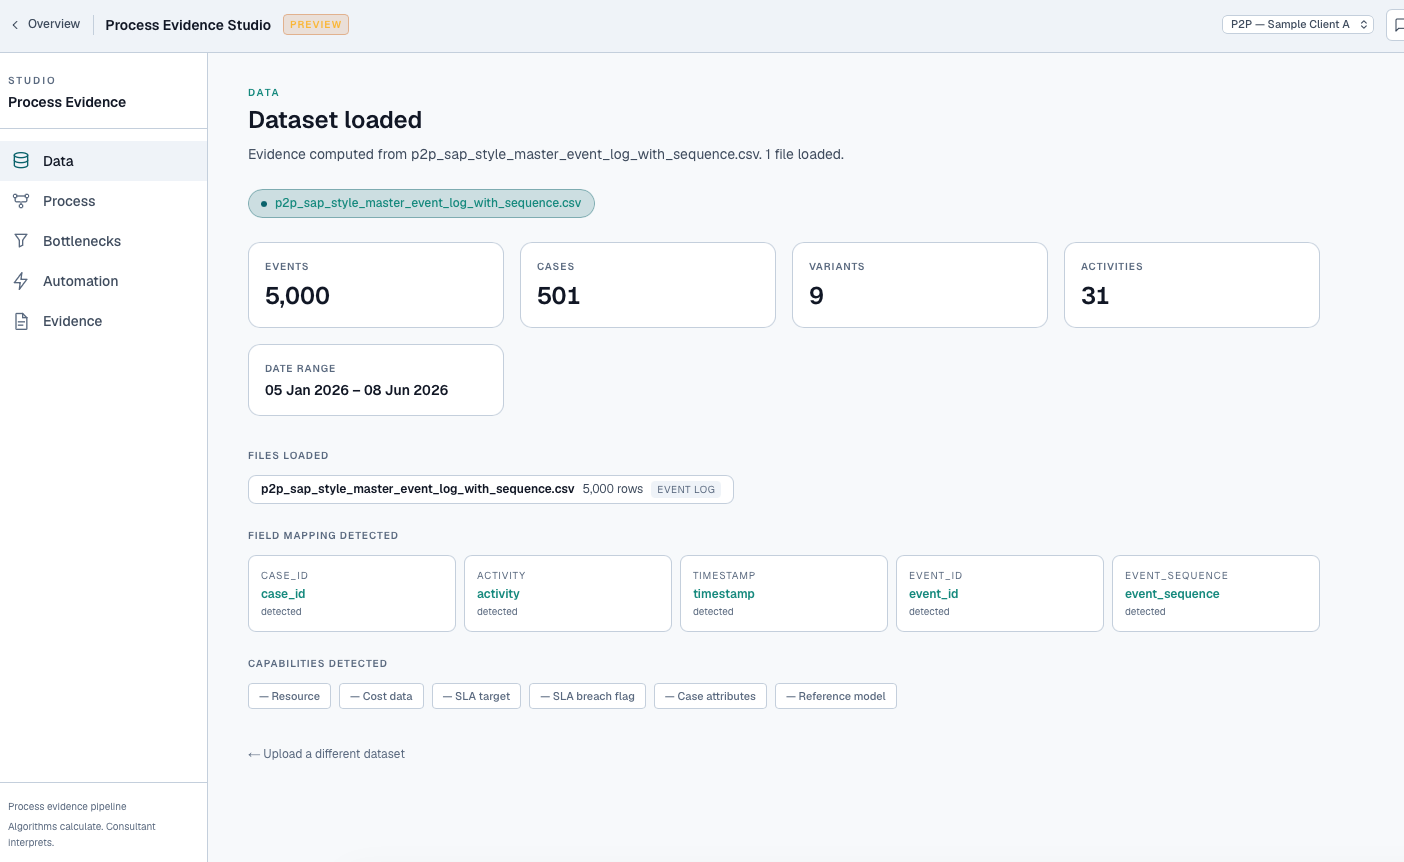
Upload an event log. PES detects field roles automatically (case identifier, activity name, timestamp) across single or multi-file datasets and joins them without manual configuration. The analysis pipeline runs from there.
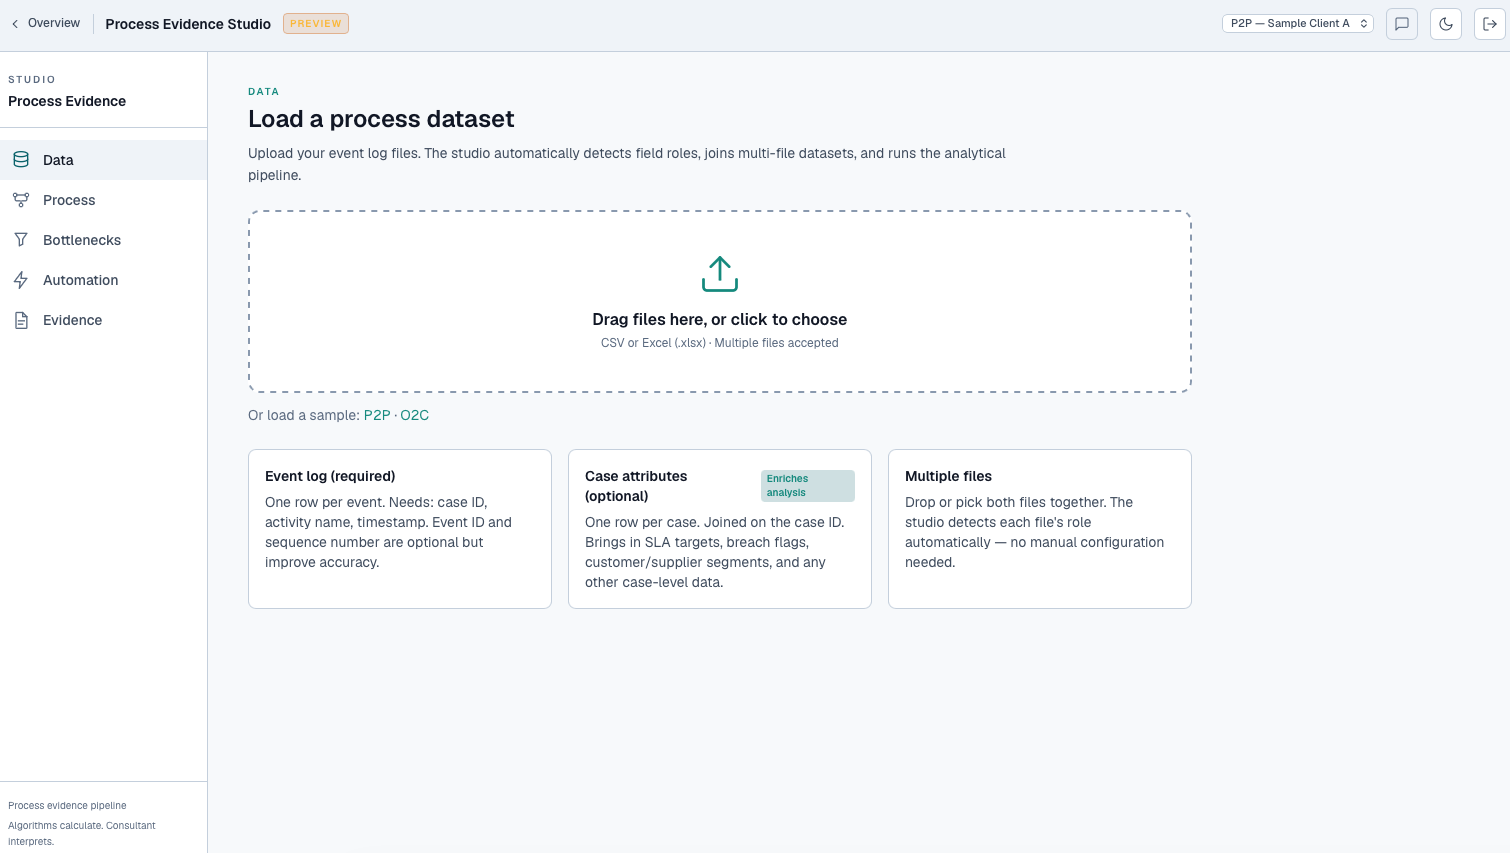
Dataset loaded
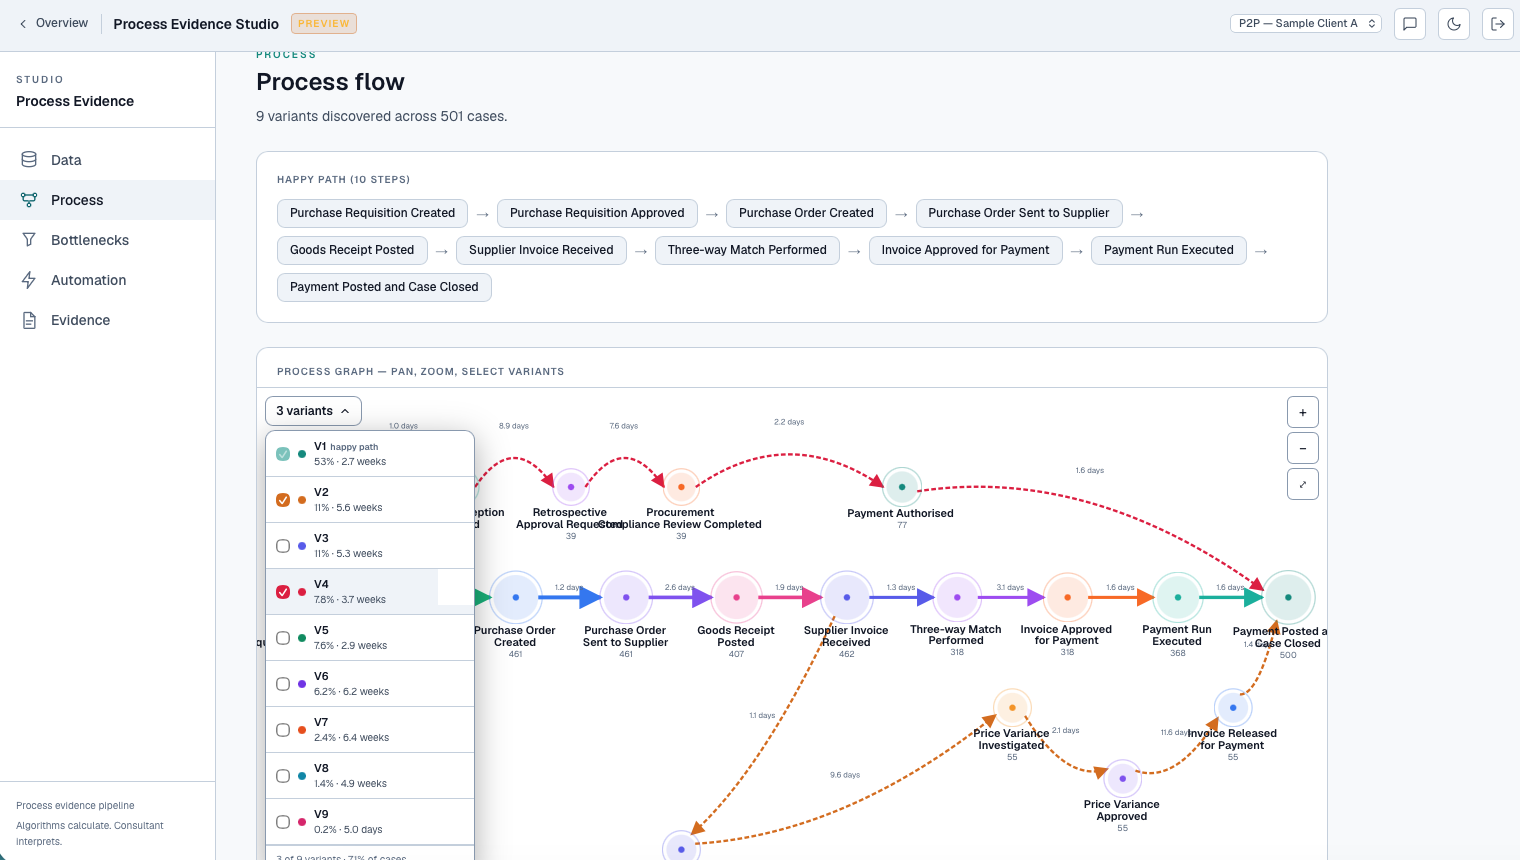
Every variant, mapped
The variant graph shows every path through the process and its frequency. The happy path is clear. So are the deviations. The gap between the two is not a diagram: it is evidence, drawn from the actual event record.
Algorithms calculate. Consultant interprets.
See it run
Upload to analysis in under two minutes
PES runs against your event log in a closed environment. No data leaves your infrastructure during the diagnostic session.
Request a walkthroughThe method
How the engine separates what councils control from what their circumstances fix
Most tools that touch local government data stop at description. They show you the number. They do not tell you how much of it is structural — fixed by deprivation, age profile, funding formula. How much is controllable margin that management decisions can actually move. Parallax was built to answer the second question.
Structural versus controllable margin
OLS decomposition · 151 upper-tier English councils · open public data
The engine in output: local government benchmarking
Each point is a council. The vertical axis is actual performance. The horizontal axis is what context predicts. The diagonal is the match line. Points above it are outperforming their circumstances. Points below are not. The colour separates structural from controllable variation.
Parallax local government — benchmark output
Every test reaches a verdict
No result is suppressed. No finding is reported without passing all three gates.
Where the data stops
Each boundary is a first-class finding — not a disclaimer.
Linked individual-level data across the social care and acute boundary.
Individual CHC assessment records joined to diagnosis and care history.
Granular prevention spend by programme joined to admissions by mechanism code.
Linked screening and GP two-week-wait referral data at PCN level.
Internal service satisfaction and support response time data — available within the authority, not public.
Corporate-core overhead: 107 of 151 upper-tier councils carry a controllable residual above their need-adjusted peers. After outlier fencing, £147.2m per year.
The method is transparent because the source data is public and the analytical steps are reproducible. What is not replicable without the engine is the plausibility map, the structural-variable selection, the lever-logic layer, and the outlier fencing. If you want to understand how this applies to a specific authority or a specific question, that is the conversation the paid engagement starts.
Request a briefing